Most reporting on African trade looks outward: cocoa to Europe, oil to Asia, machinery from China. Far less attention goes to the goods that move between African countries themselves.
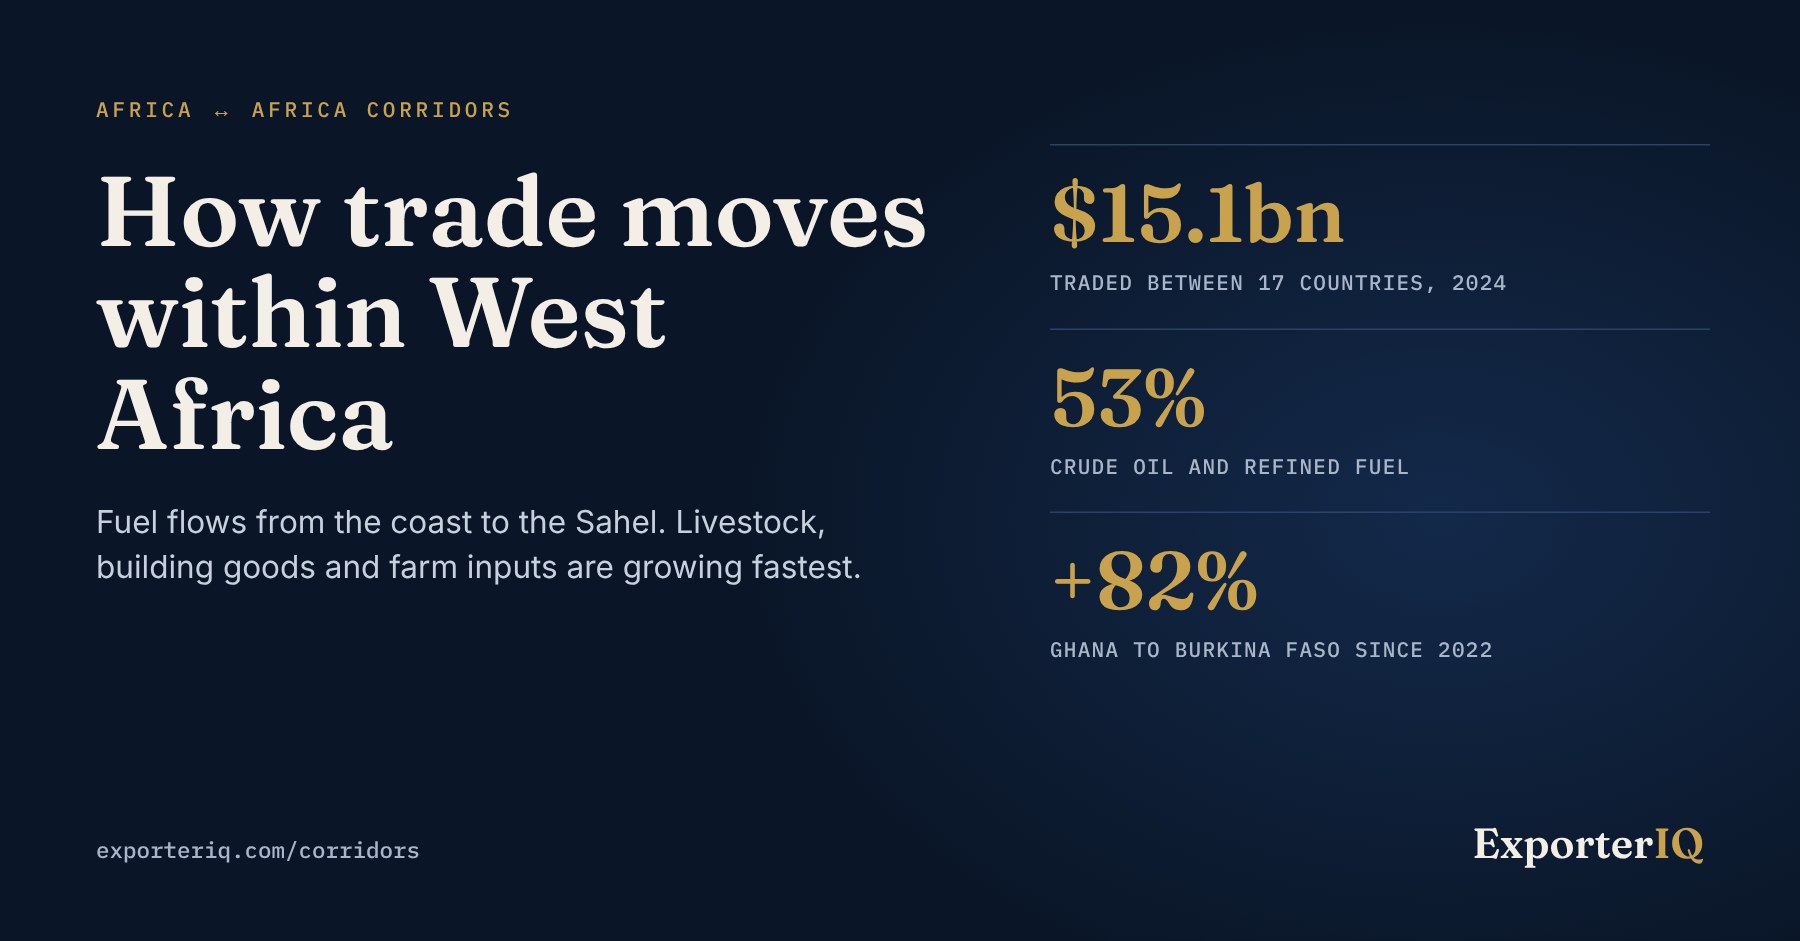
ExporterIQ tracks 136 trade corridors between 17 countries in West and Central Africa: Benin, Burkina Faso, Cabo Verde, Cameroon, Côte d'Ivoire, The Gambia, Ghana, Guinea, Guinea-Bissau, Liberia, Mali, Mauritania, Niger, Nigeria, Senegal, Sierra Leone and Togo. Together they traded $15.1bn of goods with each other in 2024.
For context, Afreximbank puts total intra-African trade, across all 54 African countries, at $190.9bn in 2023, with West Africa the second largest trading region at 23.4% of the total (Africa in Figures 2024). The figures in this article are narrower by design: they count only goods moving between these 17 countries, as recorded by customs. The section About our data, at the end, explains how the two compare.
This article follows that trade: what moves, which routes carry the most, which are growing, and where the opportunities sit for traders who want to sell within the region.
$15bn a year, and steady
Trade between the 17 countries has held at around $15bn a year:
- 2022: $15.5bn
- 2023: $15.3bn
- 2024: $15.1bn
- 2025: $16.6bn, from the reports received so far
The total is stable, but what sits inside it is not. Some routes have almost doubled since 2022 while others have shrunk by a third. The movement is in the detail.
Fuel is more than half of it
The single largest thing West African countries sell each other is energy. Refined petroleum products, such as petrol and diesel, were worth $4.89bn in 2024. Crude oil added $3.17bn. Together, those two lines make up 53.3% of all trade between the 17 countries.
Add electricity ($425m), petroleum gases ($205m) and petroleum coke and bitumen ($142m), and energy reaches 58.4% of the total.
The pattern is simple. Nigeria sells crude oil to the coastal countries with refineries and ports. Crude to just three buyers, Côte d'Ivoire, Senegal and Togo, was worth $3.05bn in 2024. Those coastal countries then send refined fuel inland, to Mali, Burkina Faso, Liberia and their neighbours.
Electricity follows a similar route. Ghana sold Burkina Faso $146m of electricity in 2024, and Nigeria sold Togo $55m.
Beyond fuel: what else moves
Outside energy, intra-regional trade is made up of the goods small and mid-sized traders deal in every day. The largest non-energy lines in 2024:
- Frozen fish: $451m, down from $551m in 2022
- Cement: $425m, almost unchanged
- Ceramic tiles: $214m, up 29% since 2022
- Palm oil: $194m, down 52%
- Soups, broths and seasoning preparations, the category that includes stock cubes: $156m
- Live cattle: $152m, almost double the 2022 figure
- Oil seeds: $132m, up 13%
- Plastic pipes and fittings: $131m, up from $51m
- Vegetable fats and oils: $128m, up from $19m
- Raw cotton: $128m, up 35%
- Mixed fertilisers: $108m, up 16%
- Insecticides and other crop protection: $102m, almost three times the 2022 level
- Live sheep and goats: $83m, up 87%
- Paper and board packaging: $69m
Three groups stand out. Building materials (cement, tiles and plastic pipes) together reach $770m. Livestock is booming: cattle, sheep and goats moved $234m across borders in 2024, against $121m in 2022. And farm inputs (fertilisers and crop protection) are growing quickly as agriculture expands.
The routes that carry the most
The ten largest country-to-country flows in 2024, with the main goods on each:
- Nigeria to Côte d'Ivoire: $2.36bn, almost all crude oil
- Senegal to Mali: $1.36bn, fuel ($982m) and cement ($157m)
- Côte d'Ivoire to Mali: $1.32bn, fuel ($977m), palm oil and cement
- Côte d'Ivoire to Burkina Faso: $990m, fuel, tobacco products and fertilisers
- Nigeria to Togo: $632m, crude oil, electricity and gas
- Ghana to Burkina Faso: $618m, fuel, electricity and gas
- Côte d'Ivoire to Liberia: $548m, mostly fuel
- Nigeria to Senegal: $517m, mostly crude oil
- Nigeria to Ghana: $297m
- Senegal to The Gambia: $245m, vehicles, fuel and rice
The routes growing fastest
Among the 20 largest flows, several have grown sharply since 2022:
- Senegal to Burkina Faso: $159m, almost five times the 2022 level
- Mali to Côte d'Ivoire: $179m, almost four times
- Senegal to The Gambia: $245m, three times
- Côte d'Ivoire to Guinea: $181m, up 91%
- Ghana to Burkina Faso: $618m, up 82%
- Togo to Benin: $181m, up 74%
- Côte d'Ivoire to Burkina Faso: $990m, up 63%
- Burkina Faso to Ghana: $241m, up 54%
Others have shrunk. Nigeria's sales to Niger fell 33% to $193m, and to Benin 26% to $171m. Senegal's sales to Mali, still the second largest flow, fell 15%.
Who supplies, and who buys
The region has a clear shape: coastal suppliers and inland buyers.
The main suppliers to the rest of the group in 2024 were Nigeria ($4.50bn), Côte d'Ivoire ($3.87bn) and Senegal ($2.39bn), followed by Ghana ($1.34bn) and Togo ($828m). Ghana's sales to its neighbours grew 20% since 2022. Mali's grew from $238m to $585m.
The main buyers were Côte d'Ivoire ($3.31bn), Mali ($3.07bn) and Burkina Faso ($1.99bn). Burkina Faso's purchases from the group grew 57% since 2022, the fastest of any large buyer. Fuel from Senegal and Côte d'Ivoire alone makes up almost two thirds of Mali's purchases.
Côte d'Ivoire is both: the second largest supplier and the largest buyer. It buys crude oil, mainly from Nigeria, and sells refined fuel, palm oil, cement and tobacco products to its neighbours. It is the region's busiest trading hub.
What this means for traders
- The landlocked Sahel buys through the coast. Mali, Burkina Faso and Niger source most of what they buy in the region through ports in Senegal, Côte d'Ivoire, Ghana, Togo and Benin. Distributors in those ports serve several markets at once.
- Building goods are a growth line. Tiles, pipes and cement move in volume, and plastic pipes have more than doubled since 2022.
- Food and farm inputs move every day. Fish, seasonings, vegetable oils, livestock, fertilisers and crop protection are traded by small and mid-sized companies, not only large groups.
- Check the counterparty. Many intra-regional buyers and sellers have little public information. Verify a new partner's registration, trade activity and contact details before the first shipment.
About our data
ExporterIQ's corridor figures come from official customs statistics: the trade each country's customs authority records and reports to the United Nations (UN Comtrade). Every figure is a declared shipment of goods, classified by 4-digit product code and valued in US dollars.
Two reports for every flow. Each shipment can appear twice, once in the exporting country's statistics and once in the importing country's. ExporterIQ uses the importer's report, the usual choice in trade analysis because imports are checked at the border to collect duty. Where the importer has not reported, we use the exporter's report. This is known as mirror data, and it is why Guinea, Guinea-Bissau and Sierra Leone, which do not report, still appear in the corridors.
The two sides agree. On the region's largest routes, the two reports are close. In 2024, Senegal recorded $1.31bn of exports to Mali, and Mali recorded $1.33bn of imports from Senegal. In 2023, Nigeria recorded $2.62bn of exports to Côte d'Ivoire, and Côte d'Ivoire recorded $2.64bn of imports from Nigeria.
Why continental figures are larger. Estimates such as Afreximbank's $190.9bn of intra-African trade in 2023 are built differently:
- They cover all 54 African countries, not the 17 in these corridors.
- They draw on the IMF's Direction of Trade Statistics, which add estimates where official reports are missing or incomplete.
- A country's intra-African trade adds its exports and its imports together, while the totals in this article count each shipment once.
The difference shows on individual routes too. Afreximbank's figures put Mali's imports from Senegal at around $3.1bn in 2023. The customs reports of both countries record $1.2bn to $1.4bn.
What customs data does not include. Informal cross-border trade, goods that cross land borders without being declared, is a large part of commerce in West Africa and does not appear in customs statistics. Neither does trade in services. Recorded figures are therefore a floor rather than the full size of the trade, but they are the most reliable view of what moves on each route, product by product.
2025 figures are based on the reports received so far. Several countries have not yet reported 2025, so this article uses 2024 for every comparison.
Explore the corridors
Every route in this article has its own corridor page on ExporterIQ, with what moves in each direction and how it has changed since 2022.
Explore the Africa ↔ Africa corridors: exporteriq.com/corridors
Written by Andre Biyog, ExporterIQ.