Beer, wine, spirits, soft drinks, bottled water and vinegar all trade under one product code: 22. In 2025 the world imported $90.2bn of them, according to the 121 countries that have reported so far, and exported $106.5bn.
For an exporter, the size of the global market matters less than two other questions: where the demand sits, and which markets are still growing. A market that is large but shrinking can be harder to win than a smaller one that is expanding every year.
This guide uses ExporterIQ's Market finder data for product code 22 to answer both questions. It covers the largest importing markets, the fastest growing ones, the countries you will compete against, and a simple method for choosing your next market.
What product code 22 covers
Product code 22 is the chapter of the Harmonized System, the international customs classification, for beverages, spirits and vinegar. It includes:
- Mineral and aerated waters, and soft drinks
- Beer made from malt
- Wine, including sparkling wine and vermouth
- Cider, perry, mead and other fermented drinks
- Spirits, such as whisky, rum, gin, vodka and liqueurs
- Ethyl alcohol, including industrial alcohol
- Vinegar
Because the chapter is broad, a country's total can hide very different stories. A market growing fast in soft drinks may be flat in wine. Market finder shows the chapter as a whole, so treat it as the starting point and then check your own product line within it.
How to read the figures
Three measures appear throughout this guide.
- Imports or exports: the value a country traded in 2025, in US dollars.
- Share: that country's part of the total reported for 2025.
- Growth: the average yearly rate of change since 2022. A market growing 10% a year has grown by about a third over three years.
The 2025 figures are partial. 121 importing countries have reported so far and more are still to report, so totals will rise as they do. Rankings and growth rates between countries that have reported are the most useful part of the data today.
One market buys almost a third
The USA imported $28.0bn of beverages and spirits in 2025, 31.0% of everything reported. No other country comes close. The Netherlands is second at $6.4bn, and China third at $5.1bn.
Together, those three markets account for 43.7% of reported imports. The top 15 account for 77.7%.
The largest markets after the top three:
- Japan, $3.4bn
- Belgium, $3.4bn
- Italy, $3.4bn
- Hong Kong, $3.0bn
- Canada, $2.9bn
- Singapore, $2.9bn
- Switzerland, $2.6bn
- Poland, $2.3bn
- Australia, $2.0bn
- Ireland, $1.8bn
- Denmark, $1.6bn
- Austria, $1.5bn
The markets, group by group
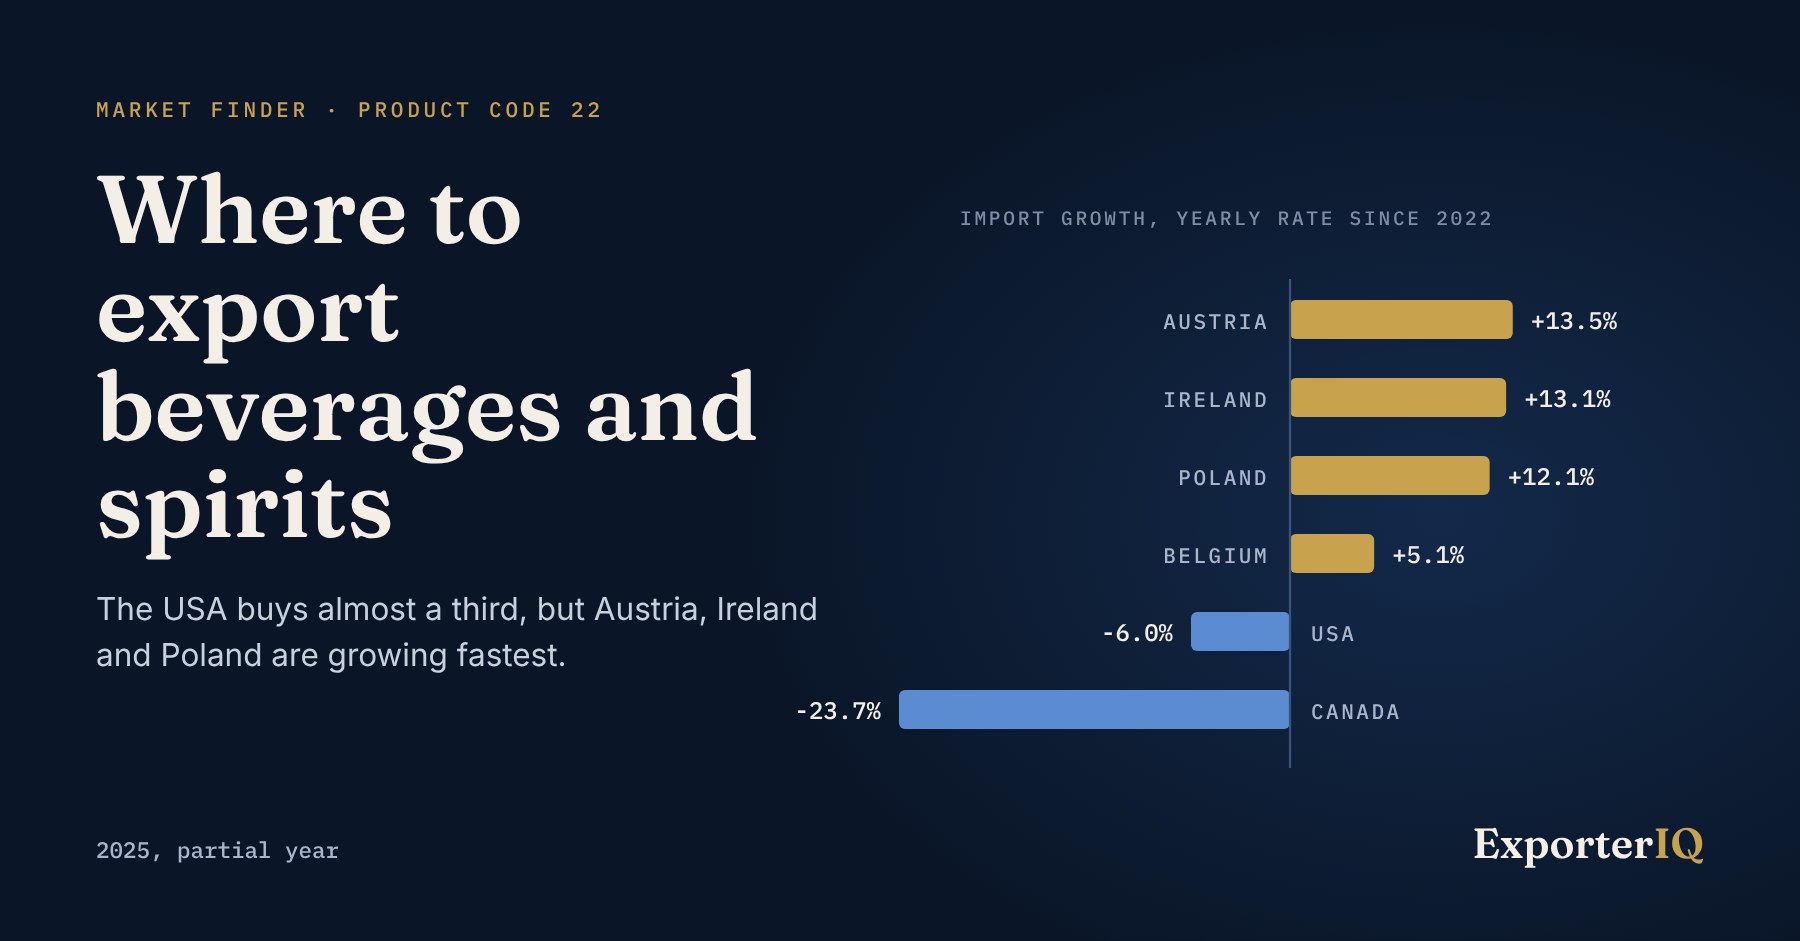
The USA. The largest market by a wide margin, and the most competitive. Imports have fallen 6.0% a year since 2022, so a new supplier is competing for a share of a market that is getting smaller. The USA remains worth targeting, but it rewards exporters with a clear product, a strong importer partner and the budget to support a brand.
The Netherlands and Belgium. Both are among Europe's main port and distribution hubs, so part of what they import moves on to other European markets. The Netherlands imported $6.4bn, almost flat at -1.4% a year. Belgium imported $3.4bn and is growing 5.1% a year. For many exporters, an importer or distributor in either country is a route into several European markets at once.
Asia. China ($5.1bn, -2.3% a year) and Japan ($3.4bn, -3.8% a year) are large but shrinking slightly. Hong Kong ($3.0bn) is growing 3.8% a year, while Singapore ($2.9bn) has fallen 5.8% a year. Hong Kong and Singapore both act as regional trading centres, so demand there also reflects trade with neighbouring markets.
Canada and Australia. Canada shows the sharpest fall in the top 15, down 23.7% a year, and Australia is down 6.8% a year. Both remain sizeable markets, but neither is where demand is growing.
Mid-sized Europe. This is where the growth is, as the next section shows.
The markets growing fastest
Measured as the yearly rate since 2022, three mid-sized European markets stand out:
- Austria: $1.5bn in 2025, growing 13.5% a year
- Ireland: $1.8bn, growing 13.1% a year
- Poland: $2.3bn, growing 12.1% a year
Belgium (+5.1% a year), Italy (+3.9%), Hong Kong (+3.8%) and Switzerland (+1.6%) are also growing.
For a new exporter, these markets change the picture. Each is large enough to support real volume, and growing fast enough that new suppliers are being taken on rather than replaced. They are also smaller and less contested than the USA, which makes a first importer relationship easier to win.
Who you are competing with
The leading suppliers are the competitors in each market, and often the partners too.
Italy is the largest exporter at $14.1bn, 13.2% of reported exports, followed by Mexico at $11.8bn and the USA at $10.8bn. Together the top three account for 34.4% of reported exports. The USA is both the largest buyer and the third largest seller.
The suppliers gaining ground fastest:
- China: $3.3bn, growing 12.3% a year
- Poland: $2.2bn, growing 7.6% a year
- Germany: $8.9bn, growing 6.0% a year
- Ireland: $2.5bn, growing 5.3% a year
- South Africa: $1.6bn, growing 4.7% a year
Poland and Ireland appear on both lists. They are growing as buyers and as sellers, a sign of active drinks trade in both directions. Italy is the same: the largest exporter, and a growing importer at 3.9% a year.
South Africa is the only African country among the top 15 exporters. For drinks producers elsewhere in Africa, that shows both the gap and the opportunity: the category is open to African suppliers, but few have reached scale in export markets.
How to choose your next market: a five-step method
- Start with growth, not size. Shortlist markets growing faster than the average, then check that each is big enough for your volumes.
- Check the competition. Look at which countries already supply each shortlisted market. Competing with Italian wine in Italy is a different task from offering a new spirit in Poland.
- Narrow to your product line. Code 22 is broad. Confirm that demand for your specific drink, not only the chapter, is growing.
- Find the buyers. Market finder shows the buyers listed in each market. Review their trade activity to find importers already handling products like yours.
- Check the rules and the partner. Confirm labelling, duty and licensing rules, then verify the importer before the first order.
Rules to check before you ship drinks
Drinks are among the most regulated goods in international trade, and the rules differ by market and by product. Before shipping, exporters usually need to confirm:
- Excise duty: most markets charge excise on alcohol, on top of customs duty and sales tax, often by alcohol content or volume.
- Licensed importers: many markets only allow licensed importers or distributors to bring in alcohol.
- Labelling: language, alcohol content, allergens and health warnings vary by country.
- Product standards: limits on additives, sweeteners and production methods, especially for wine and spirits.
- Certificates: certificates of origin, and in some cases analysis or health certificates.
ExporterIQ's country guides set out the documents, duties and import rules for each market.
What this means for exporters
- Look past the USA. It is the largest market, but demand there has fallen every year since 2022. Test a growing market alongside it.
- Watch Ireland. It is growing quickly as a buyer, and ExporterIQ already lists 11 Irish buyers and 13 Irish suppliers in the category.
- Use the hubs. An importer in the Netherlands or Belgium can open several European markets at once.
- Check the buyer before the first order. Drinks are high value per container. Verify a new importer's details before you ship.
Frequently asked questions
Which country imports the most beverages and spirits?
The USA, with $28.0bn of imports in 2025, 31.0% of the total reported.
Which drinks markets are growing fastest?
Among the 15 largest importers, Austria (+13.5% a year since 2022), Ireland (+13.1%) and Poland (+12.1%).
Which country exports the most beverages and spirits?
Italy, with $14.1bn in 2025, followed by Mexico and the USA.
Is any African country among the leading drinks exporters?
South Africa, with $1.6bn of exports in 2025, growing 4.7% a year. It is the only African country in the top 15.
Find the buyers
ExporterIQ lists 2,233 buyers and 1,176 suppliers of beverages, spirits and vinegar, with their trade activity on each profile. Market finder shows the full ranking for every product code, with each country's share, growth and the buyers listed there.
Find where your product sells: exporteriq.com/market-finder
2025 figures are partial: 121 importing countries have reported so far, and more are still to report. Growth is the yearly rate since 2022.
Written by Andre Biyog, ExporterIQ.